The measure, introduced as the pandemic began, allowed banks to exclude Treasuries and deposits with the Fed from the calculation of the leverage ratio. The Standard & Poor's 500 fell 2.36 points (0.06%) to 3,913.1 points.
S&P 500, H4
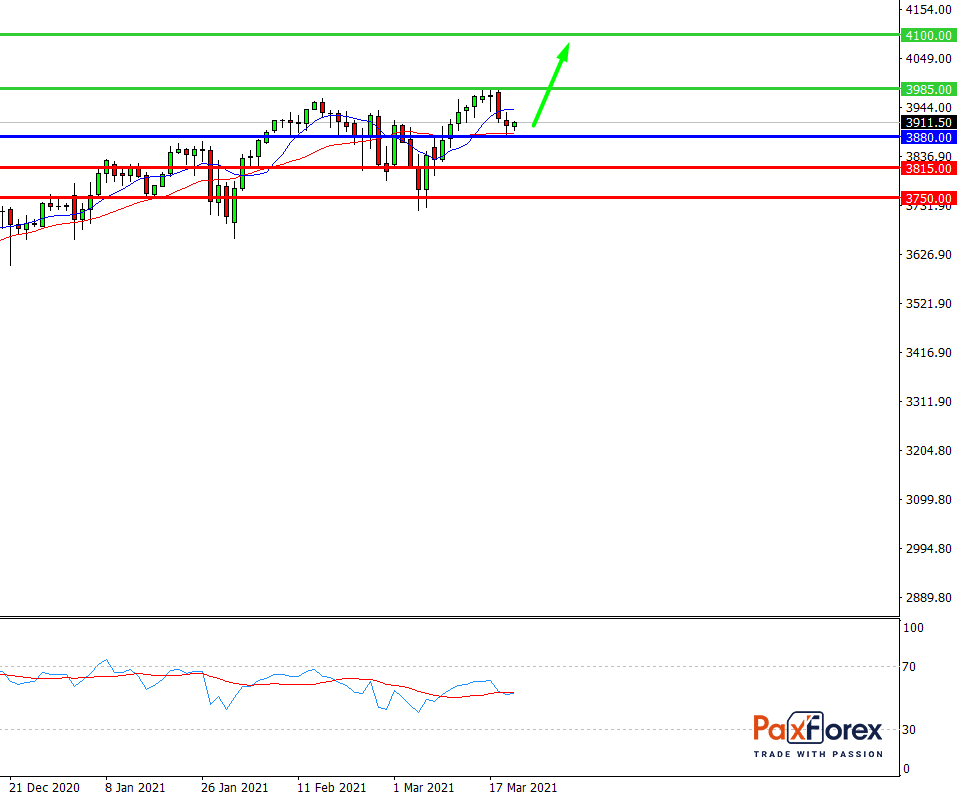
Pivot: 3911.00
Analysis:
Provided that the index is traded above 3880.00, follow the recommendations below:
- Time frame: H4
- Recommendation: long position
- Entry point: 3911.00
- Take Profit 1: 3985.00
- Take Profit 2: 4100.00
Alternative scenario:
In case of breakdown of the level 3880.00, follow the recommendations below:
- Time frame: H4
- Recommendation: short position
- Entry point: 3880.00
- Take Profit 1: 38615.00
- Take Profit 2: 3750.00
Comment:
RSI indicates an uptrend during the day.
Key levels:
Resistance Support
4150.00 3880.00
4100.00 3815.00
3985.00 3750.00
S&P 500, D1
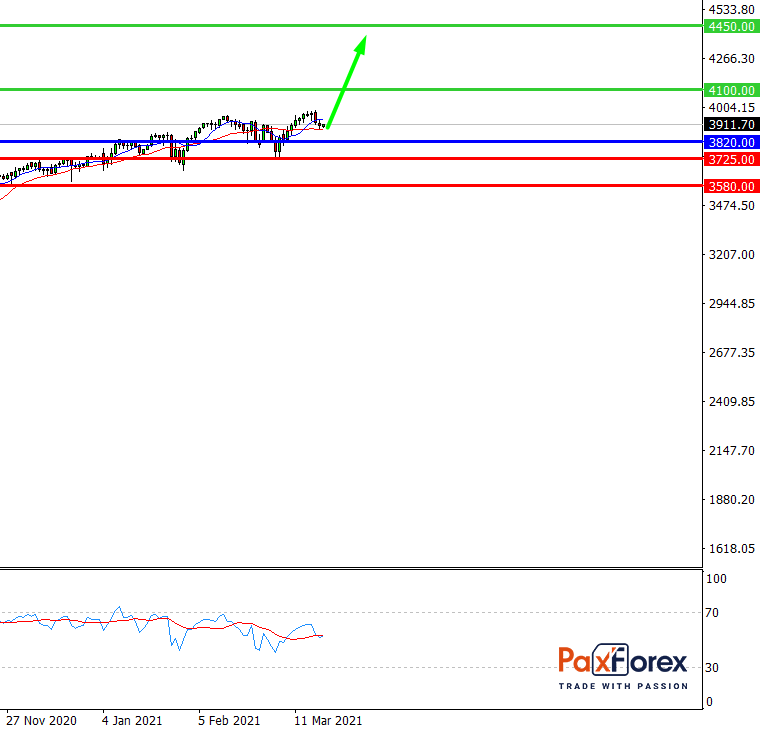
Pivot: 3922.00
Analysis:
While the price is above 3820.00, follow the recommendations below:
- Time frame: D1
- Recommendation: long position
- Entry point: 3922.00
- Take Profit 1: 4040.00
- Take Profit 2: 4450.00
Alternative scenario:
If the level 3820.00 is broken-down, follow the recommendations below:
- Time frame: D1
- Recommendation: short position
- Entry point: 3820.00
- Take Profit 1: 3725.00
- Take Profit 2: 3580.00
Comment:
RSI is bullish and indicates further increase.
Key levels:
Resistance Support
4500.00 3820.00
4450.00 3725.00
4110.00 3580.00
EUR/USD | Euro to US Dollar Trading Analysis
EUR/JPY | Euro to Japanese Yen Trading Analysis
Recent articles

EUR/JPY | Euro to Japanese Yen Trading Analysis