The market was supported earlier this week by a decline in U.S. Treasuries, as well as optimism over the approval of a coronavirus vaccine made by Johnson & Johnson (NYSE: JNJ) and the prospects of a new aid package for the U.S. economy. The yield on 10-year U.S. government bonds fell below 1.45% this week after jumping to a high for the year of 1.6% a week earlier. The Standard & Poor's 500 fell 31.53 points (0.81%) to 3,870.29 points.
S&P 500, H4
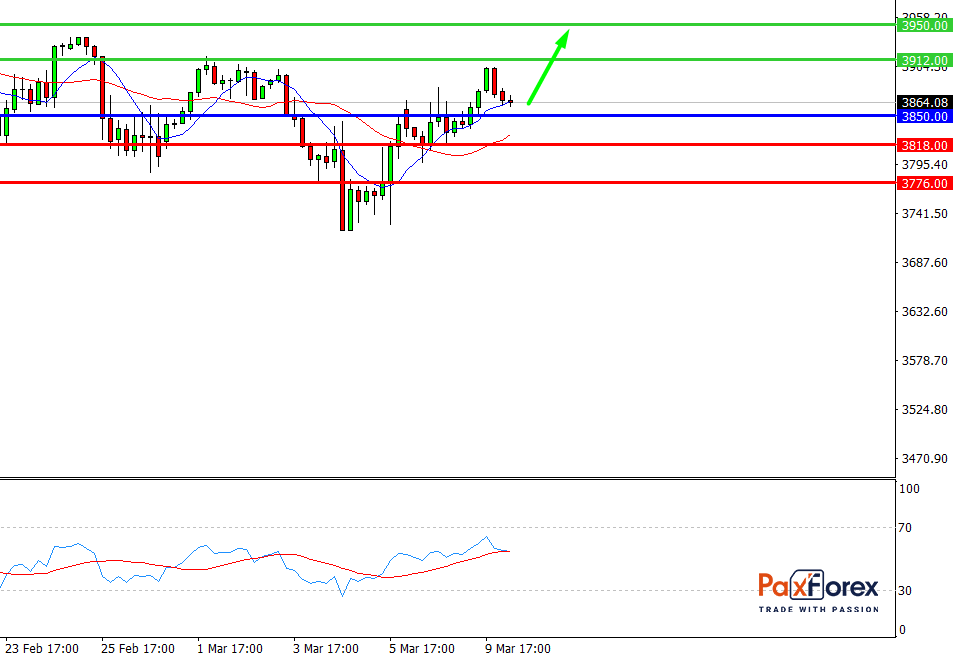
Pivot: 3885.00
Analysis:
Provided that the index is traded above 3850.00, follow the recommendations below:
- Time frame: H4
- Recommendation: long position
- Entry point: 3885.00
- Take Profit 1: 3912.00
- Take Profit 2: 3950.00
Alternative scenario:
In case of breakdown of the level 3850.00, follow the recommendations below:
- Time frame: H4
- Recommendation: short position
- Entry point: 3850.00
- Take Profit 1: 3818.00
- Take Profit 2: 3776.00
Comment:
RSI indicates an uptrend during the day.
Key levels:
Resistance Support
3975.00 3850.00
3950.00 3818.00
3912.00 3776.00
S&P 500, D1
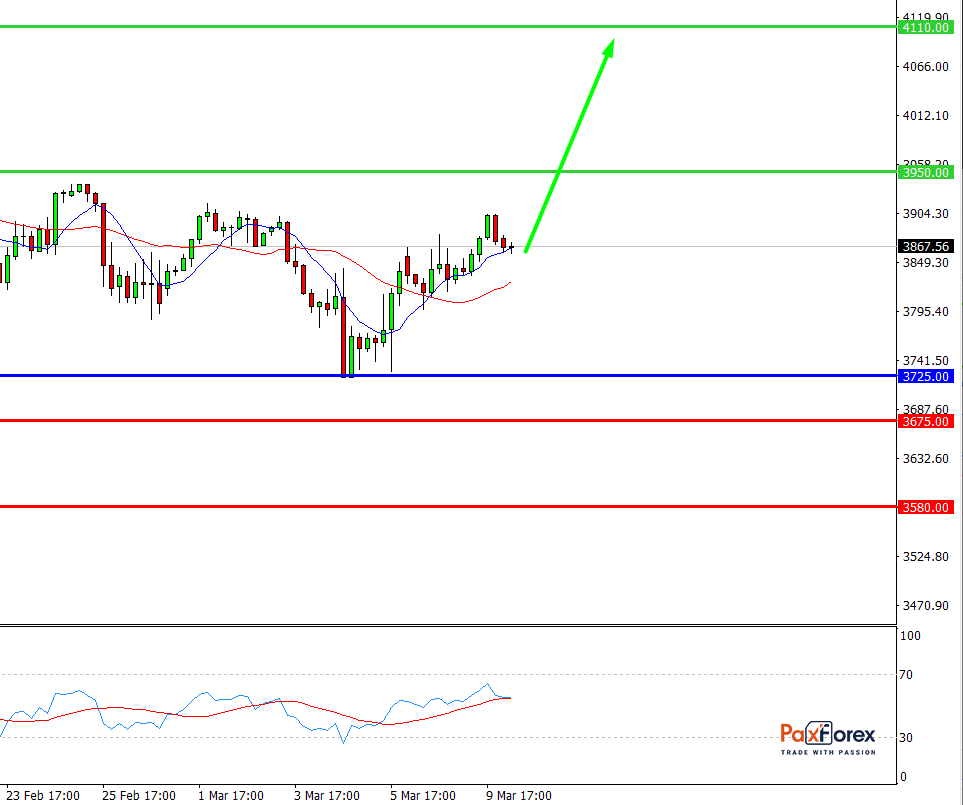
Pivot: 3902.00
Analysis:
While the price is above 3725.00, follow the recommendations below:
- Time frame: D1
- Recommendation: long position
- Entry point: 3902.00
- Take Profit 1: 3950.00
- Take Profit 2: 4110.00
Alternative scenario:
If the level 3725.00 is broken-down, follow the recommendations below:
- Time frame: D1
- Recommendation: short position
- Entry point: 3725.00
- Take Profit 1: 3675.00
- Take Profit 2: 3580.00
Comment:
RSI is bullish and indicates further increase.
Key levels:
Resistance Support
4260.00 3725.00
4110.00 3675.00
3950.00 3580.00
USD/CHF | US Dollar to Swiss Franc Trading Analysis
EUR/JPY | Euro to Japanese Yen Trading Analysis
Recent articles

EUR/JPY | Euro to Japanese Yen Trading Analysis