The yield on ten-year US Treasuries on Monday fell to 1.682% compared with 1.729% on Friday. That gave support to tech company securities, which have been winning in the COVID-19 pandemic but have been under pressure in recent days due to rising government bond yields. The Dow Jones Industrial Average index was up 103.23 points (0.32%) at 32731.2 by market close after declining for two straight sessions.
Dow Jones 30, H4
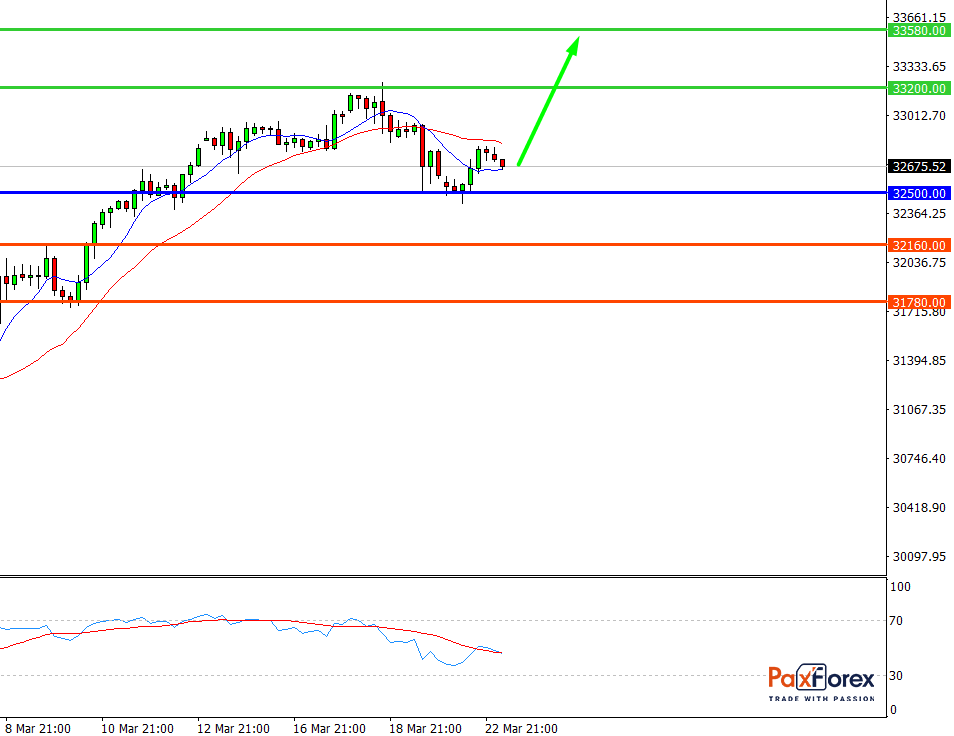
Pivot: 32746.00
Analysis:
Provided that the index is traded above 32500.00 , follow the recommendations below:
- Time frame: H4
- Recommendation: long position
- Entry point: 32746.00
- Take Profit 1: 33200.00
- Take Profit 2: 33580.00
Alternative scenario:
In case of breakdown of the level 32500.00 , follow the recommendations below:
- Time frame: H4
- Recommendation: short position
- Entry point: 32500.00
- Take Profit 1: 32160.00
- Take Profit 2: 31780.00
Comment:
RSI indicates an uptrend during the day.
Key levels:
Resistance Support
34000.00 32500.00
33580.00 32160.00
33200.00 31780.00
Dow Jones 30, D1
Pivot: 32755.00
Analysis:
While the price is above 32000.00, follow the recommendations below:
- Time frame: D1
- Recommendation: long position
- Entry point: 32755.00
- Take Profit 1: 34100.00
- Take Profit 2: 34750.00
Alternative scenario:
If the level 32000.00 is broken-down, follow the recommendations below.
- Time frame: D1
- Recommendation: short position
- Entry point: 32000.00
- Take Profit 1: 30880.00
- Take Profit 2: 29850.00
Comment:
RSI is bullish and indicates a mid-term uptrend.
Key levels:
Resistance Support
37125.00 32000.00
34750.00 30880.00
34100.00 29850.00
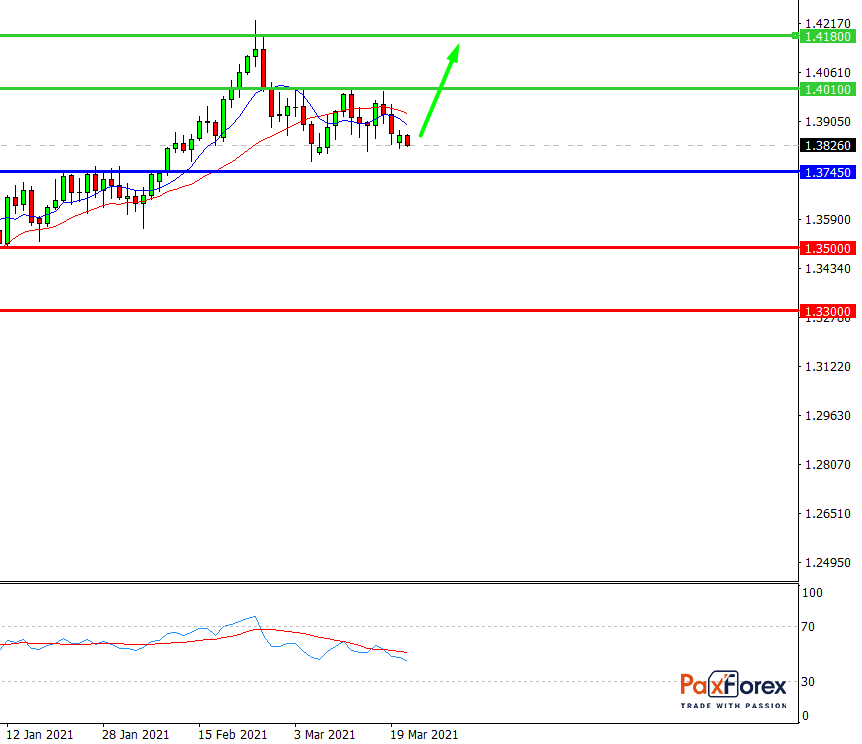
GBP/USD | British Pound to US Dollar Trading Analysis
EUR/JPY | Euro to Japanese Yen Trading Analysis
Recent articles

EUR/JPY | Euro to Japanese Yen Trading Analysis