The Dow Jones Industrial Average index fell 308.05 points (0.94%) to 32423.15 points.
Nasdaq 100, H4
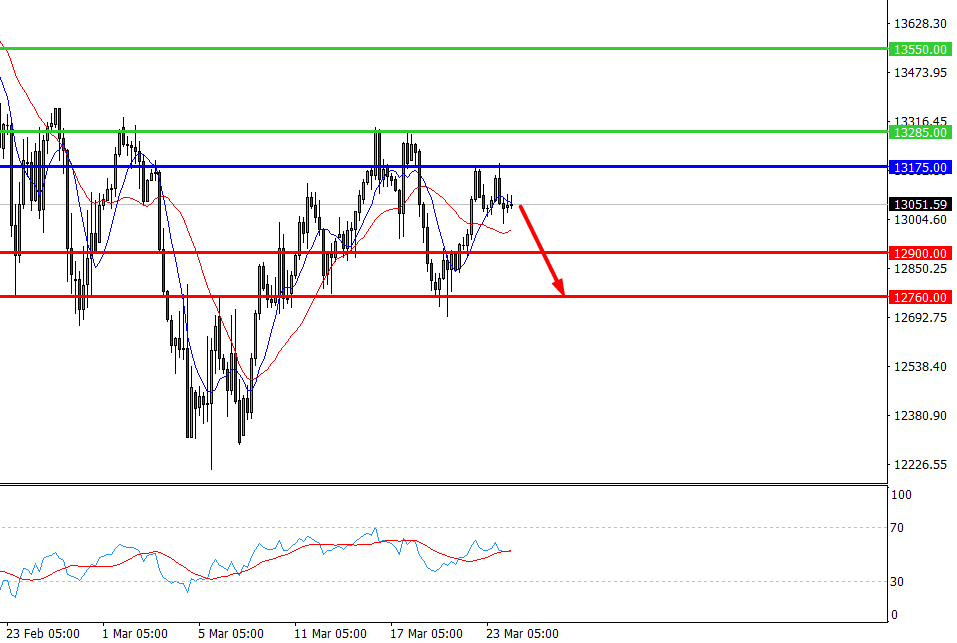
Pivot: 13017.00
Analysis:
Provided that the index is traded below 13175.00, follow the recommendations below:
- Time frame: H4
- Recommendation: long position
- Entry point: 13017.00
- Take Profit 1: 12900.00
- Take Profit 2: 12760.00
Alternative scenario:
In case of breakout of the level 13175.00, follow the recommendations below:
- Time frame: H4
- Recommendation: long position
- Entry point: 13175.00
- Take Profit 1: 13285.00
- Take Profit 2: 13550.00
Comment:
RSI indicates a downtrend during the day.
Key levels:
Resistance Support
13550.00 12900.00
13285.00 12760.00
13175.00 12530.00
Nasdaq 100, D1
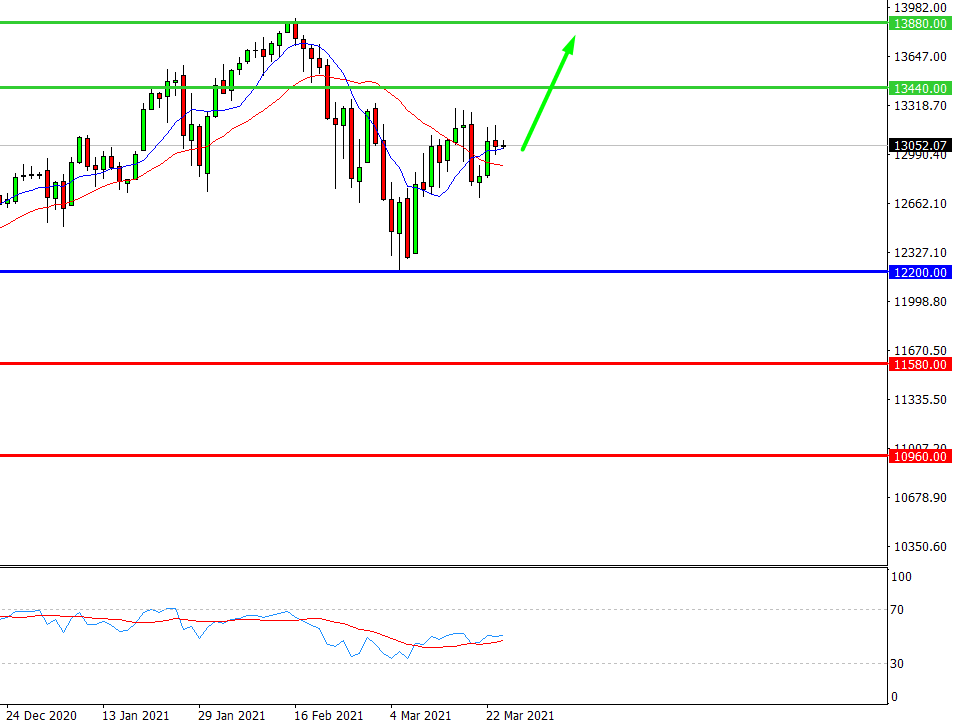
Pivot: 12857.00
Analysis:
Provided that the index is traded above 12200.00, follow the recommendations below:
- Time frame: D1
- Recommendation: long position
- Entry point: 12857.00
- Take Profit 1: 13400.00
- Take Profit 2: 13880.00
Alternative scenario:
In case of breakdown of the level 12200.00, follow the recommendations below:
- Time frame: D1
- Recommendation: short position
- Entry point: 12200.00
- Take Profit 1: 11580.00
- Take Profit 2: 10960.00
Comment:
RSI is bullish and indicates further increase.
Key levels:
Resistance Support
14650.00 12200.00
13880.00 11580.00
13440.00 10960.00
Verizon | Fundamental Analysis
Prev article
EUR/JPY | Euro to Japanese Yen Trading Analysis
Next article
Recent articles

EUR/JPY | Euro to Japanese Yen Trading Analysis
ECB head Lagarde: so far we see no signs that inflationary pressures are becoming widespread.

GBP/JPY | British Pound to Japanese Yen Trading Analysis
GBP/JPY is declining from 2-week highs, approaching 151.50.