The market demonstrates some uncertainty on the background of the negative dynamics from the oil and gas, financial and industrial sectors. The Dow Jones was up 0.30 percent at the close on the New York Stock Exchange, hitting an all-time high.
Nasdaq 100, H4
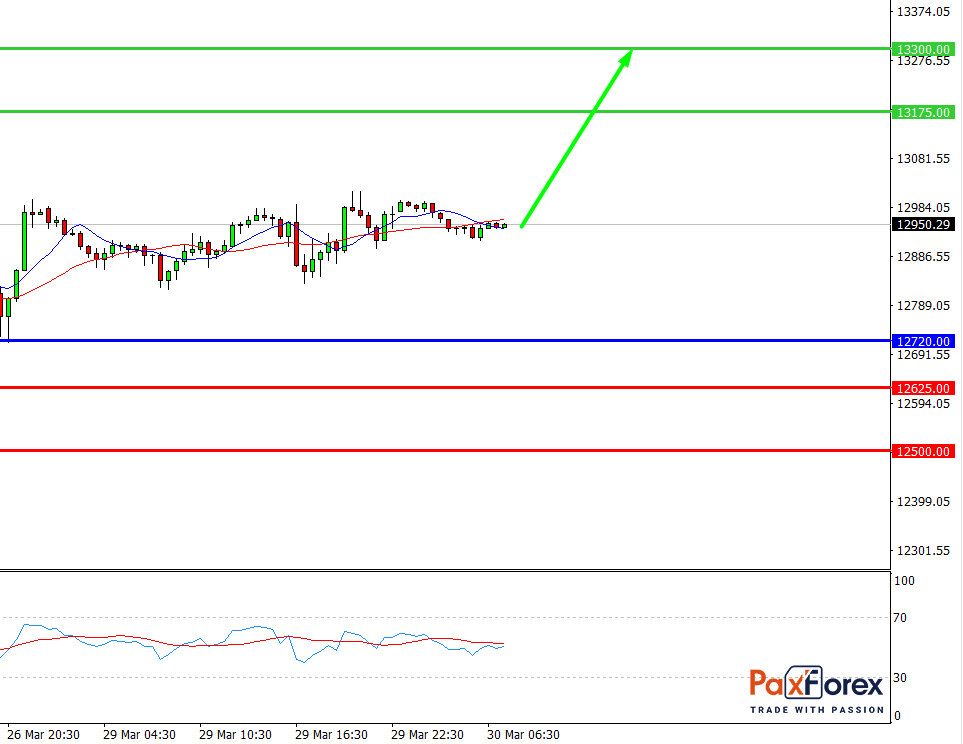
Pivot: 12979.00
Analysis:
Provided that the index is traded above 12720.00, follow the recommendations below:
- Time frame: H4
- Recommendation: long position
- Entry point: 12979.00
- Take Profit 1: 13175.00
- Take Profit 2: 13300.00
Alternative scenario:
In case of breakdown of the level 12720.00, follow the recommendations below:
- Time frame: H4
- Recommendation: short position
- Entry point: 12720.00
- Take Profit 1: 12625.00
- Take Profit 2: 12500.00
Comment:
RSI indicates an uptrend during the day.
Key levels:
Resistance -- Support
13500.00 ---- 12720.00
13300.00 ---- 12625.00
13175.00 ---- 12500.00
Nasdaq 100, D1
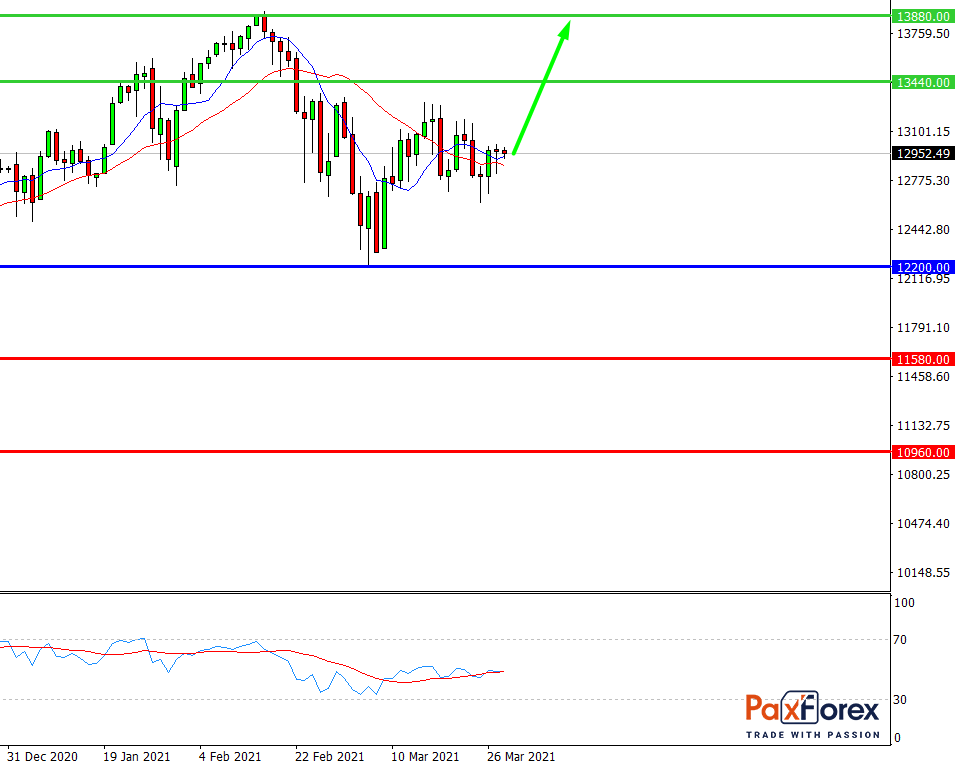
Pivot: 12979.00
Analysis:
Provided that the index is traded above 12200.00, follow the recommendations below:
- Time frame: D1
- Recommendation: long position
- Entry point: 12979.00
- Take Profit 1: 13400.00
- Take Profit 2: 13880.00
Alternative scenario:
In case of breakdown of the level 12200.00, follow the recommendations below:
- Time frame: D1
- Recommendation: short position
- Entry point: 12200.00
- Take Profit 1: 11580.00
- Take Profit 2: 10960.00
Comment:
RSI is bullish and indicates further increase.
Key levels:
Resistance -- Support
14650.00 ---- 12200.00
13880.00 ---- 11580.00
13440.00 ---- 10960.00
USD/CHF | US Dollar to Swiss Franc Trading Analysis
EUR/JPY | Euro to Japanese Yen Trading Analysis
Recent articles

EUR/JPY | Euro to Japanese Yen Trading Analysis