The US Empire Manufacturing Index for May is predicted at 23.9. Forex traders can compare this to the US Empire Manufacturing Index for April, reported at 26.3. The US NAHB Housing Market Index for May is predicted at 83. Forex traders can compare this to the US NAHB Housing Market Index for April, reported at 83.
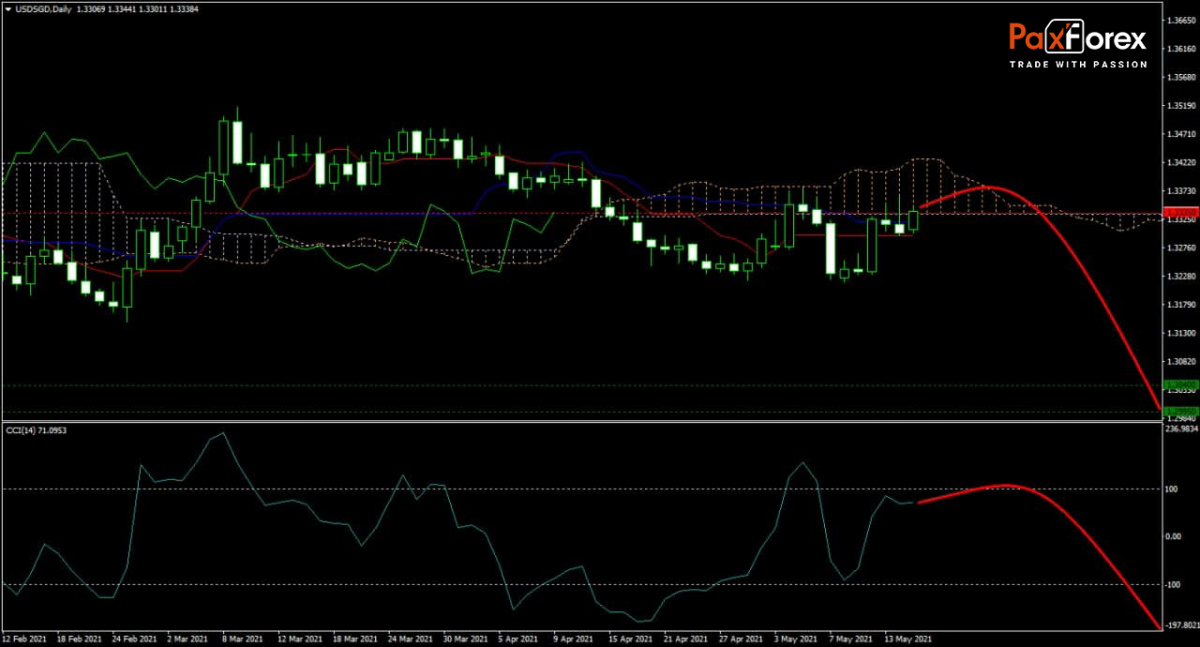
The forecast for the USD/SGD turned bearish again after this currency pair advanced into its Ichimoku Kinko Hyo Cloud. Economic and inflation data out of the US suggest overall worse conditions than central bankers and economists forecasted. Volatility is likely to increase as the Tenkan-sen and the Kijun-sen sidelined below the descending Ichimoku Kinko Hyo Cloud. The CCI moved out of extreme overbought territory, confirming a weakening bullish trend, and has more room to the downside.

Should price action for the USD/SGD remain inside the or breakdown below the 1.3300 to 1.3365 zone, recommend the following trade set-up:
- Timeframe: D1
- Recommendation: Short Position
- Entry Level: Short Position @ 1.3335
- Take Profit Zone: 1.2995– 1.3040
- Stop Loss Level: 1.3390
Should price action for the USD/SGD breakout above 1.3365, recommend the following trade set-up:
- Timeframe: D1
- Recommendation: Long Position
- Entry Level: Long Position @ 1.3390
- Take Profit Zone: 1.3475 – 1.3515
- Stop Loss Level: 1.3365
Microsoft | Fundamental Analysis
EUR/JPY | Euro to Japanese Yen Trading Analysis
Recent articles

EUR/JPY | Euro to Japanese Yen Trading Analysis
